


Will rising business rates prompt exodus to cheaper areas?
The freeze on business rates imposed by Jeremy Hunt is due to end in April, which has led to fears of crippling cost increases for small businesses. Money.co.uk business loans decided to look into which areas have the highest commercial property rents – which affects the business rates that are charged – as well as which areas have the most available commercial units. This will allow them to ascertain the most commercially viable areas for struggling businesses to relocate to.
Their research revealed that areas such as Birmingham, Somerset and County Durham provide rents under £100 per sqm as well as being in the top 10 for highest property availability and choice:
- Westminster has the highest number of available properties as well as the highest rent
- Birmingham has the second most properties available after Westminster, yet the rent is seven times less.
- Birmingham, Somerset and County Durham provide rates under £100 per sqm as well as being in the top 10 for the highest property availability
- West Lindsay ranks 31st on the list of places with the most available properties, as well as ranking number five on the list of cheapest rent.
- West Lancashire is in the top 20 for lowest rent but is also one of the top 50 areas with the most available properties – making it a good place for new businesses to set up.
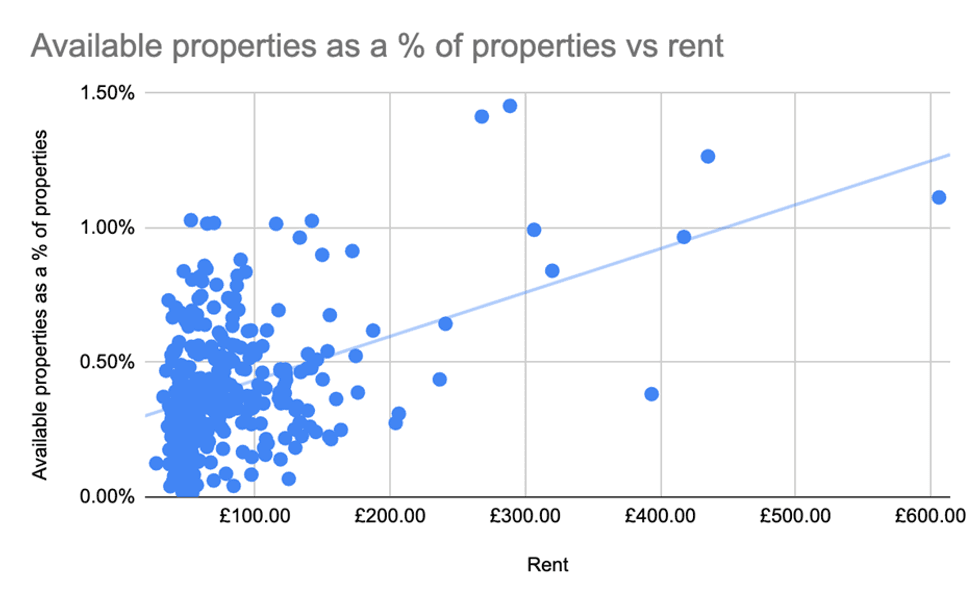
The research also revealed that generally, the areas with the lowest rents have the least number of properties available. This reinforces the notion that rents are something businesses consider a priority when deciding where to base themselves.
The graph below shows that as rent increases, so does the amount of available properties.
“With the business rates rise on the horizon of the coming year, small business owners might find the impact is multifaceted. Small businesses often operate on tight budgets, so an increase in business rates can strain their finances, leading to reduced profits or even financial losses," said loans expert Cameron Jaques of Money.co.uk business loans, speaking about how important it is for small business owners to factor increasing rates into their long-term plans.
“Higher operating costs due to increased business rates may also make it harder for small businesses to compete with larger corporations. They may struggle to offer competitive prices or invest in growth initiatives.
“Finally, as business rates are typically paid annually or semi-annually, small businesses might experience cash flow issues when they have to set aside a significant amount of money to cover the increased rates.
“Relocating your business to an area with lower rates can be disruptive and costly in the short term, as it involves moving personnel, equipment, and potentially establishing new customer relationships. However, if it mitigates the aforementioned problems concerning cash flow and profit, it might be worth considering.”
Top 10 cities with lowest business rates/rent:
| Local authority | Available properties | Available properties as a % of properties | Total area (m/2) | Total rent value | Rent per sqm | # of properties |
| North Lincolnshire | 21 | 0.13% | 3494843 | £93,530,952.00 | £26.76 | 16775 |
| North East Lincolnshire | 64 | 0.37% | 2733747 | £87,755,212.00 | £32.10 | 17201 |
| Rossendale | 44 | 0.47% | 1011056 | £34,450,638.00 | £34.07 | 9374 |
| Powys | 47 | 0.26% | 1503739 | £53,095,380.00 | £35.31 | 17922 |
| West Lindsey | 56 | 0.73% | 1037290 | £37,210,212.00 | £35.87 | 7664 |
| Erewash | 42 | 0.34% | 1582457 | £57,269,856.00 | £36.19 | 12377 |
| Neath Port Talbot | 16 | 0.12% | 1510105 | £54,962,356.00 | £36.40 | 13037 |
| Blaenau Gwent | 12 | 0.18% | 826422 | £30,135,475.00 | £36.47 | 6830 |
| East Riding of Yorkshire | 15 | 0.04% | 4910816 | £182,570,575.00 | £37.18 | 37465 |
| Mid Suffolk | 34 | 0.34% | 1510932 | £56,344,265.00 | £37.29 | 9958 |
Top 10 cities with the highest number of available properties as a % of properties
| Local authority | Available properties | Available properties as a % of properties | Total area (m/2) | Total rent value | Rent per sqm | # of properties |
| Islington | 403 | 1.45% | 2274858 | £656,439,477.00 | £288.56 | 27733 |
| Hackney | 371 | 1.41% | 1663931 | £445,415,177.00 | £267.69 | 26242 |
| City of London | 425 | 1.27% | 7418676 | £3,228,031,247.00 | £435.12 | 33579 |
| Westminster | 1021 | 1.11% | 7954997 | £4,821,811,742.00 | £606.14 | 91714 |
| Oadby and Wigston | 46 | 1.03% | 546422 | £28,623,559.00 | £52.38 | 4472 |
| Watford | 87 | 1.03% | 1017077 | £144,356,655.00 | £141.93 | 8476 |
| Cheshire West and Chester | 355 | 1.02% | 4133994 | £287,504,282.00 | £69.55 | 34866 |
| Warrington | 222 | 1.02% | 3515825 | £226,415,411.00 | £64.40 | 21852 |
| Manchester | 583 | 1.02% | 6493418 | £749,825,333.00 | £115.47 | 57435 |
| Southwark | 307 | 0.99% | 2834875 | £868,604,049.00 | £306.40 | 30922 |